A dashboard is an interactive display that you can use to quickly and easily explore your business data. For example, you can perform the following tasks:
To view dashboards, you must have the following privileges:
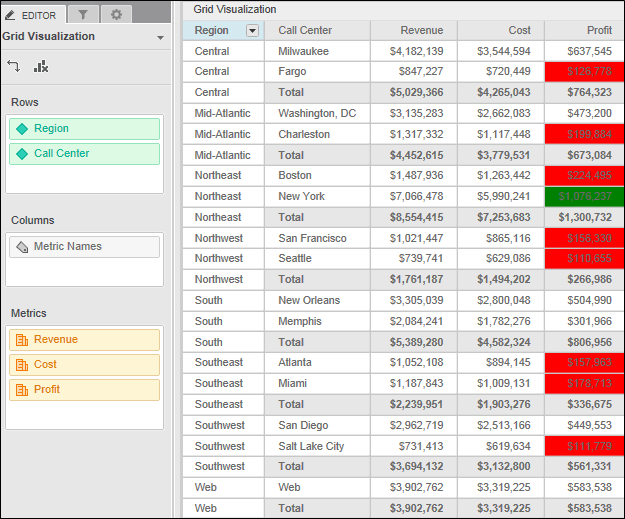
In the image below, data in a dashboard is displayed using a Grid visualization, which contains profit data for each Call Center in a Region. Small profit values are displayed in red, mid-range profit values are displayed in orange, and large profit values are displayed in yellow.

Related concepts
Understanding the parts of a document
Saving and exporting a dashboard
Related tasks
Recovering dossiers documents and reports
Running and viewing a dashboard
About Report Services documents
Analyzing data using visualizations in a dashboard
Running and viewing a Report Services document
Analyzing data in an ESRI Map visualization
Analyzing data in a Google Map visualization
Analyzing data in a Heat Map visualization
Analyzing data in a Network visualization
Analyzing data in a Graph visualization
Analyzing data in a Grid visualization
Filtering or highlighting the data in a visualization based on selections in another visualization
 Copyright Numerify, Inc. All Rights Reserved ©2021