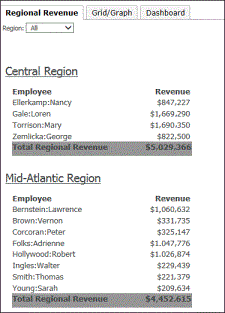
A sample document is displayed below in Presentation Mode:

The parts of a document are described below:
Most of the information on a document is from an underlying dataset. A dataset is a set of data that can be displayed on a document. A dataset can be a report, an Intelligent Cube, or data imported directly from an external data source. Reports include Freeform SQL reports, Query Builder reports, MDX cube reports, and reports that access Intelligent Cubes. Intelligent Cubes can be based on Numerify data or imported data. The information in a dataset can include objects such as attributes, custom groups, consolidations, and metrics.
In the document sample above, the employee names and the revenue amounts are retrieved from the dataset. As an analyst, you do not see the underlying datasets that provide the data; you see the data itself instead.
Other information that does not originate from the dataset is stored in the document’s definition. In the document sample above, for instance, the words “Employee” and “Revenue” are not part of the dataset.
Metrics are objects that represent business measures and key performance indicators. From a practical perspective, metrics are the calculations that are performed on data stored in your data source, the results of which are displayed on a dashboard. Metrics are similar to formulas in spreadsheet software.
A metric is calculated differently depending on its location in the document. For example, the Revenue metric next to each employee is calculated at the level of the employee. The same Revenue metric next to the text “Total Regional Revenue” calculates all the revenue for the specific region.
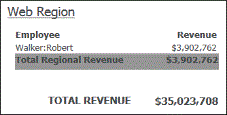
The end of the sample document was not included in the previous image; below you can see the total revenue for the entire document. The same Revenue metric was used, but because of its location in the document it calculates as a grand total.
A hyperlink connects text or an image in a document to a web page (the target of the hyperlink). When you hover the cursor over text that contains a hyperlink, the cursor changes to a hand.
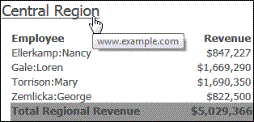
Click the hyperlinked text to open the target (in this example, the website www.example.com) in another window.
If a document is organized so that the data is grouped by page, drop-down lists are displayed at the top of the screen, as shown in the portion of the sample document displayed below. You can select which elements, or subsets of data, to display. Each subset of data is called a page. The document sample above displays all regions.
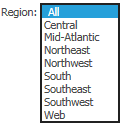
Pages result from a document designer creating groups on the document. Grouping information together helps people who read the document to understand the data better.
A multi-layout document contains multiple documents, each in its own layout, creating a “book” of documents. Each layout functions as a separate document, with its own grouping, page setup, and so on, but the layouts are generated into a single PDF document. If a document contains multiple layouts, tabs are displayed at the top of the screen. Click a tab to select which layout to display.
The sample document above displays the Regional Revenue layout. Click the Grid/Graph tab, and that layout is now displayed, as shown below.
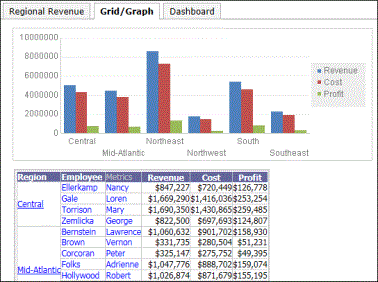
When you export a multi-layout document to Excel, each layout is placed into a separate worksheet of the spreadsheet. When you export a multi-layout document to a PDF file, each layout starts on a new page.
A Grid/Graph is the object used to display reports on documents. Like a report, a Grid/Graph can be displayed as a grid, a graph, or both:
Grid: displays as a standard grid with rows and columns of attributes and metrics, as shown below.

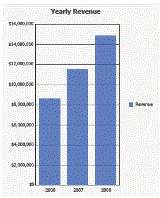
Graph: displays the data visually like a standard graph. The same Grid/Graph is shown below as in graph view.
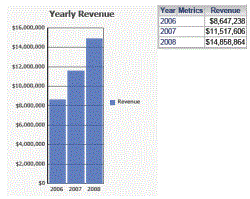
Grid and Graph: displays both grid and graph views simultaneously. The same Grid/Graph is shown below in Grid and Graph view.
A Grid/Graph is usually referred to as "grid" or "graph", depending on its display state, throughout the documentation.
The data on the grid or graph comes from a dataset report, just as the attribute or metric data comes from a dataset report.
If the data in the dataset report changes (for example, new employees are added to the data warehouse), the data in the grid or graph on the document changes. However, changes, such as formatting the employee names, made to the report are not propagated to the grid or graph in the document. If an object, such as the Employee attribute, is removed from the report, it cannot be displayed in the grid or graph in the document.
Related concepts
Getting started with documents
Linking to other documents and reports
Related tasks
Recovering dossiers documents and reports
Running and viewing a dashboard
 Copyright Numerify, Inc. All Rights Reserved ©2021