For example, each panel can display a different grid, and the selector allows you to choose which panel, and thus which grid, to view.
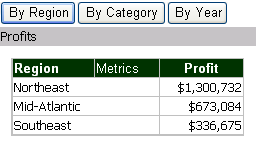
Selectors provide dossier-style documents with interactivity, allowing each user to change how he sees the data. A selector can change panels, the focus of a grid or graph report, or dynamic text fields (a text field that is a reference to an object on a report) in a panel stack, as described below.
Selectors enable you to do the following:
For example, each panel can display a different grid, and the selector allows you to choose which panel, and thus which grid, to view.
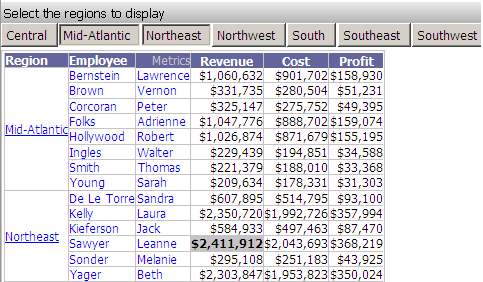
For example, a grid contains Region, Call Center, Year, and various metrics, as shown in the example below. This particular selector allows you to select which regions to display on the grid. You can therefore slice or filter the grid by the selected region or regions. Similarly, a selector can allow you to select which metrics to display. All regions and employees would be displayed, but with only the metrics chosen in the selector.


The document designer can include a title bar on the selector. If the title bar is displayed, you can also select whether to filter on the metric values or rank.

For example, a panel contains the dynamic text fields Region and Revenue from the Basic Report dataset. The selector allows you to choose which region to display on the panel. When you select Mid-Atlantic from the drop-down list of the selector, Mid-Atlantic and its revenue amount are displayed on the panel stack.

A selector can target multiple objects. The same selector can control both a grid and dynamic text fields on the same panel. As described in the "filter another selector" example above, the same selector can target both a Grid/Graph report and another selector.
You can reset all the selectors and groups on the document to their initial values, without re-executing the document. This is helpful if you want to start over and make different selections. To reset, click the menu icon ![]() on the right, and select Reset Selections.
on the right, and select Reset Selections.
An element selector or a metric condition slider selector can include or exclude the selected data. (An element selector displays different elements of attributes, custom groups, or consolidations; a metric condition slider displays a slider to filter metric values or rank.) For example, the attributes that you choose in the selector can display in the target, or they can be hidden. If the selector title bar is displayed, you can change between including or excluding the selections.
The following document contains an element selector that displays regions and targets a grid report. You can select regions and by default they are displayed rather than hidden in the grid, as shown below.
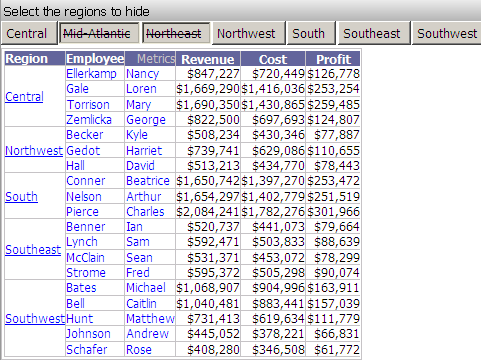
By clicking in the title bar, you can switch to hiding the selected regions. Notice in the image shown below that Northeast and Northwest are now crossed out. (Only a portion of the full grid is shown below.)
Related concepts
Getting started with documents
Understanding the parts of a document
 Copyright Numerify, Inc. All Rights Reserved ©2021