Once you are viewing a document, you can manipulate the data in the document to analyze business information. Document analysis is the process of analyzing business data displayed in existing documents. You can explore document data with the wide range of powerful functionality, such as page-by, grouping, drilling, and interaction, that document designers can make available to you.
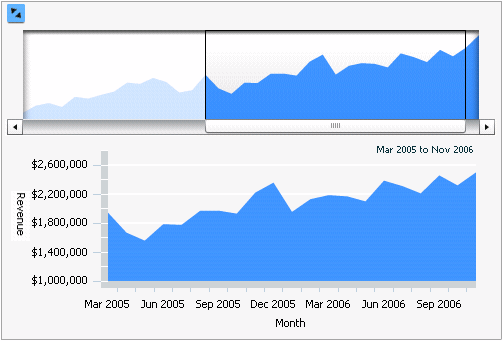
For example, the following document contains a graph that displays data for a range of a time. You can select the time range to view, to focus on a few dates or to see trends over a longer period of time.

Related tasks
 Copyright Numerify, Inc. All Rights Reserved ©2021