Open topic with navigation
Splitting a graph in to separate rows and columns
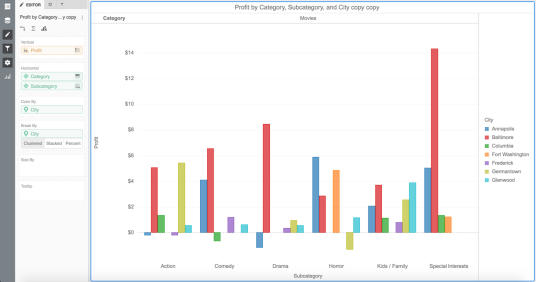
Place more than one attribute in the Vertical or Horizontal areas, to split (that is, slice) your data into rows or columns of graphs. You can split most graph types, with the exception of histograms.
Steps:
- Open an existing dossier that contains the graph you want to modify.
- Drag two or more attributes to the Vertical or Horizontal areas of the Editor panel.
Each attribute you add, after the first one, to the Vertical or Horizontal area splits your data into rows or columns of graphs.
-
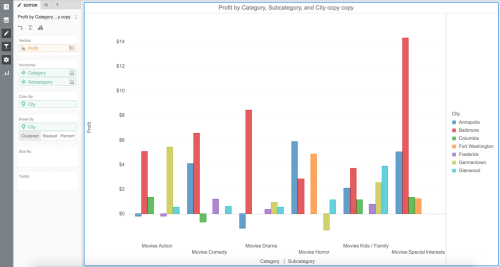
Combine the labels for both rows/columns to make the graph easier to read.
If you have two or more attributes in the Vertical area, right-click them and choose Left Axis or Right Axis.
or
If you have two or more attributes in the Horizontal area, right-click them and choose Bottom Axis or Top Axis.
 Copyright Numerify, Inc. All Rights Reserved ©2021