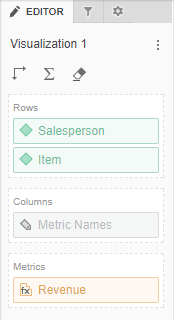
The Editor panel contains a list of all the attributes and metrics that appear as data in the selected visualization. To view the dataset objects for a specific visualization, click the visualization in the dossier.
The fields on the Editor panel differ, based on the type of visualization you create. See the following topics for information related to building each visualization type on the Editor panel:
You can use the Editor panel to perform the tasks.
Related concepts
Related tasks
Related Topics
Adding, replacing, or removing data from a visualization
Adding subtotals to a Grid visualization
How to Move Rows or Columns in a Grid
How to Sort Data in a Grid Using Multiple Objects
Swapping objects in a Grid, Graph, Waterfall Chart, or Box Plot
Adding and rearranging data in a graph visualization
How to Remove a Sort from a Grid
Abbreviating the X and Y axes in a graph visualization
Viewing information about visualization elements
How to Add Multiple Conditions to a Threshold in the Advanced Thresholds Editor
How to Format Numeric Values in a Visualization
How to Select Which Attribute Forms to Display in a Visualization
 Copyright Numerify, Inc. All Rights Reserved ©2021