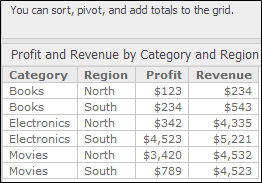
Once you have created a dashboard, you can add text to the dashboard. Text can serve as a label for your data or provide background information, a description, or instructions for the dashboard. You can reposition, resize, and format the text. In the example below, the text at the top of the dashboard provides tips for using the grid. The text has been formatted to display in a smaller font.

You can type the text to display, as in the example above, or you can drag and drop a dataset object into the text field. When you use a dataset object, the text automatically changes depending on what is displayed in the dashboard (also known as dynamic text). You can combine both text and dataset objects in the same text field.
For example, you can use a combination of text and a dataset object as a title. Your dashboard, which is filtered on the Region attribute, contains a visualization that displays metric values for your regions. Add a text field, type “Revenue and Profit Data for ” (note the extra space) in the text field, and then drag and drop the Region attribute into it. When you select the Northeast region in the Filter panel, the text field displays “Revenue and Profit Data for Northeast”, and the visualization displays metric values for the Northeast region only. If you select another region in the Filter panel, both the text field and the visualization automatically change.
You can use a text field to create a list of all the elements for an attribute. An attribute element is a value of an attribute. For example, North is an element of the Region attribute.
To do this, create a derived metric with the definition ConcatAgg(Attribute@form), replacingAttributewith the name of the attribute. (An attribute form is additional descriptive information about an attribute. For example, the attribute Customer has the forms First Name, Last Name, Address, Email Address, and so on.) Drag the derived metric into the text field. The attribute elements are displayed as a comma-separated list, such as North, South, East, West.
You can create a metric by typing a function directly in the text field.
For example, you can type {Revenue-Cost}, where
Revenue and Cost are both metrics, in the text field. The text will display
as a single value.
In the following example, text and dataset objects are combined. The words Cost = Revenue - Profit = are text that was typed in, while {REVENUE} and {COST} are the metrics displayed in the grid. A metric was created with the formula {REVENUE - COST}. The dollar sign in front of the created metric was typed, because the Revenue and Cost metrics are formatted in the dashboard, but the created metric needs the currency formatting.
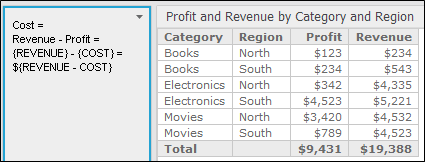
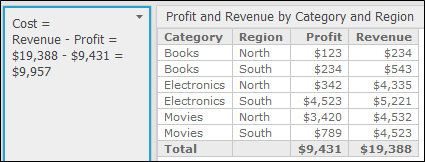
The Revenue and Cost metrics are each displayed as a single value, as shown below. They show the total of all the Revenue values and Profit values, as shown in the totals in the grid. The metric that is created is also calculated at the grand total level.
You can display dashboard information, such as the dashboard name and description, or the current date and time in a text field. The available codes are described in the following table. Be sure to include the braces ({ }) when you type the code in the text field.
| Description | Code | Sample Display |
|---|---|---|
| Date & Time Current date and time, of the client computer | {&DATETIME} | 11/15/2003 7:10:55 PM |
| Current user The full name, not the login, of the user who views the dashboard | {&USER} | Jane User |
| Dashboard name | {&DOCUMENT} | Regional Sales Summary |
| Dashboard description | {&DESCRIPTION} | Revenue and profit by region |
| Project name | {&PROJECT} | Numerify Tutorial |
| Dashboard execution time | {&EXECUTIONTIME} | 11/15/2003 7:11:15 PM |
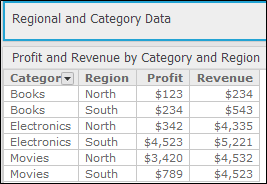
For example, you add the {&DOCUMENT} code to a text field in a dashboard named Regional and Category Data, as shown below:
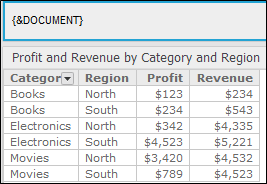
The dashboard name is displayed, as shown below:
Follow the steps below to add and format, edit, delete, or move and resize a text field in a dashboard.
You must have the Web Edit Dashboard and Web Run Dashboard privileges.
 Copyright Numerify, Inc. All Rights Reserved ©2021