Open topic with navigation
Creating a Grid visualization
Once you create a dashboard,
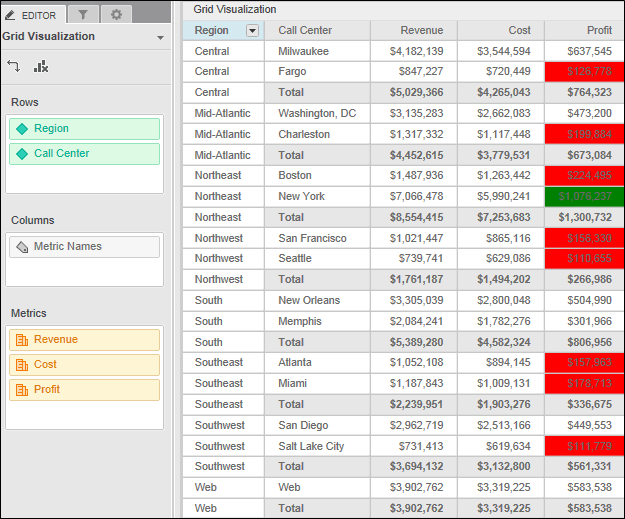
you can add a Grid visualization to the dashboard to display data in a
tabular layout, as shown in the image below.
Users can quickly interact with data in the grid to customize their
view of the information displayed in the visualization. For example, they
can:
- Sort
attribute elements or metric values in ascending or descending order,
or use multiple conditions to sort data.
- Rearrange
attributes and metrics, or swap the rows and columns displayed in
the grid.
- Filter
data to display only selected attribute elements or metric values.
- Add
and display subtotals in the grid.
- Add and display dynamic links in the grid.

You can also use a Grid visualization as an intermediate tool to understand
your data and prepare it for displaying on other types of visualizations.
For example, you can:
- Select
a subset of your business data to display by filtering and drilling
on the data in a Grid visualization, and then change the Grid visualization
into the type of visualization that you want to use to display your
data. For steps to filter or drill on data in a Grid visualization.
- Easily
view the values of attributes and metrics in a dataset. For example,
you have a dataset that contains unfamiliar data. You can quickly
familiarize yourself with the data by displaying the data in a Grid
visualization. Steps to create and add data to a Grid visualization
are provided below.
- Identify
and resolve problems with your datasets. For example, when you link
attributes that are shared in common across datasets, you can confirm
whether the data linking created the expected results by displaying
data from the linked datasets in a Grid visualization. Once you are
satisfied, you can change the visualization into the type of visualization
that you want to use to display your data.
Prerequisites
- You
must have the Web Edit Dashboard and Web Run Dashboard privileges.
- You
must have already created the dashboard to add the visualization to.
Steps to create
and add a Grid visualization to a dashboard
- Click the name of the dashboard
to run it.
- From
the toolbar, click the Insert Visualization
icon
 . A new blank visualization is added to the
dashboard and displayed.
- From the Visualization Gallery,
click the Grid icon.
- If the Datasets panel is not displayed,
from the View menu, select
Datasets Panel.
- From the Datasets
panel, click and drag attributes to the appropriate area in the Editor panel, as follows:
- For each attribute in the Editor
panel, you can select which attribute forms are displayed in the visualization.
An attribute form is a descriptive category for an attribute.
To select the attribute forms, in the Editor panel, right-click the
attribute and point to Display Attribute
Form. Select one of the following:- To display
an attribute form in the visualization, select the check box next
to its name.
- To hide
an attribute form in the visualization, clear the check box next
to its name.
- Click the Save
icon
 to save your changes.
Dynamic links in a Grid visualization
You can create dynamic links to use in a Grid Visualization. Dynamic links are created as a type of derived attribute and will appear in the dataset after you create them.
Attribute forms can be used as dynamic text in the URL Display Text and Navigate to this URL fields, which changes depending on the data in the grid. For example, your company has a website with pages for each region. The link can access the specific page for each region. To do this, include the Region attribute ID form, as in http://www.example.com/{Region@ID}.htm. Dynamic text must be typed within braces { }.
Steps to create dynamic links in a Grid visualization
- There are two methods for creating dynamic links:
- In the Link Editor dialog box:
- In the URL Display Text text box, add text, attribute forms, or both to use as the Element displayed in the grid.
- In the Navigate to this URL text box, add text, attribute forms, or both to use as the destination URL.
By default, the ID attribute form is added to the text box when you double-click or drag and drop an attribute from the left pane of the Link Editor. To modify the attribute form, edit the form in the text box by changing the value after @. As you type, matching attributes and forms are displayed
in a drop-down list.
- Optionally, click the Validate button above each text box to verify the syntax. The values are also validated when you click Save.
- Click Save. The dynamic link derived attribute is added
to the dataset.
- If you created the dynamic link attribute using the first method in step 1 and you want to add the dynamic link to the grid visualization, drag the dynamic link attribute to the grid visualization.
 Copyright Numerify, Inc. All Rights Reserved ©2021


 Copyright Numerify, Inc. All Rights Reserved ©2021