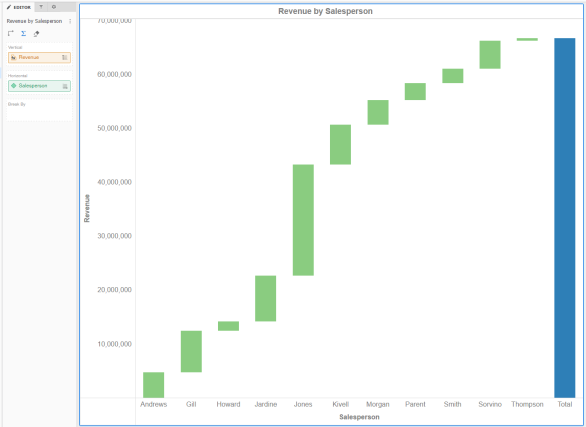
A waterfall chart visualization displays bars, representing metric values, for each element of an attribute in an ascending or descending order, leading to a final total. A waterfall chart must include at least one attribute and at least one metric.
 Copyright Numerify, Inc. All Rights Reserved ©2021