Open topic with navigation
Introduction to Geospatial Service Visualizations with Markers
You can display locations as markers in a geospatial service visualization.
Tip: Display individual retail locations with markers. Hover over a marker to view additional information for the corresponding store.
You can display markers as static image markers or bubble markers:
- Image markers are fixed size images that mark locations on a map. You can color image markers or replace them with a different images based on metric values.
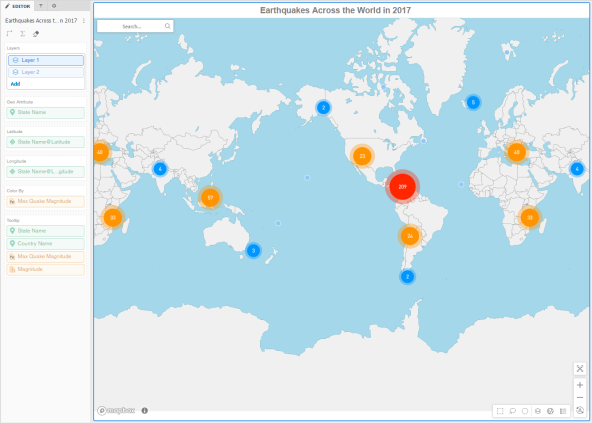
- Bubble markers provide two visual cues to help you analyze data that appears on a map: size and color. You can choose to size bubble markers based on the value of a metric. Makers with large metric values appear larger in size. Markers with small metric values appear smaller in size.
You can perform the following tasks using a geospatial service visualization with markers:
- Color markers by attribute elements or metric values.
- View different types of maps, such as topographical or satellite.
- Cluster markers in a circle when a large number of map markers appear in the same area. You can zoom in on the area and display individual map markers by clicking on a cluster.
- View additional information for locations by adding tooltips. You can display tooltips by hovering over map markers.
 Copyright Numerify, Inc. All Rights Reserved ©2021