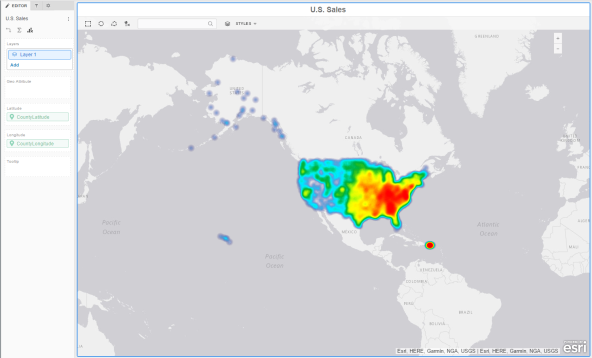
You can display locations in a map visualization using a density map. Density maps allow you to visualize patterns and trends for several geographic locations by using color gradients based on the concentration of geographic data.
Note: Density areas are available for ESRI maps only.
Example: Display locations with a high concentration of stores in red, and locations with a low concentration of stores in blue.You can perform the following tasks using a density map:
 Copyright Numerify, Inc. All Rights Reserved ©2021