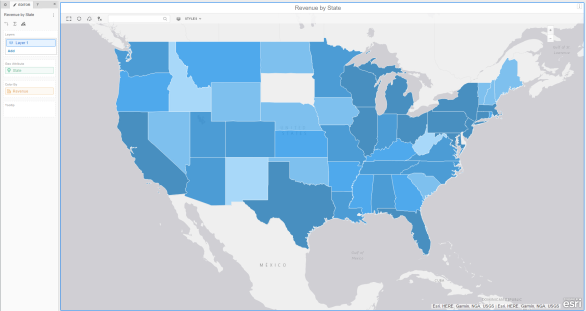
You can display locations in a map as areas. Areas are colored locations on a map that represent geographic regions (that is, countries, states, and counties). You can color-code areas based on the value of a metric.
You can perform the following tasks using a map visualization with areas:
 Copyright Numerify, Inc. All Rights Reserved ©2021