Conditional calculations can be used to supplement the conditional analysis provided with filtering and thresholds in Numerify360 for IT. You can provide conditional analysis by combining data into different groups based on the value of one or more metrics in a dossier.
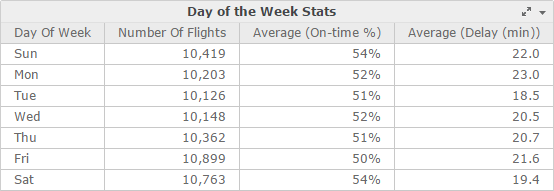
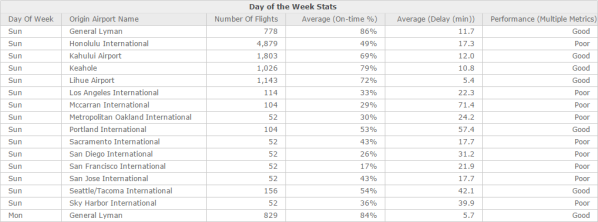
For example, your visualization allows you to view the number of flights for each day of the week, along with the percentage of on-time flights and the average delay in minutes.
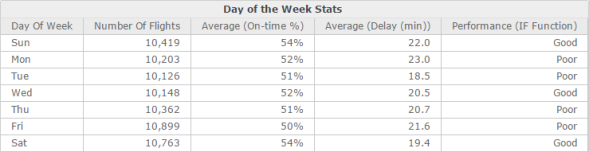
You can assess the performance of flights based on the average on-time percentage. An average on-time percentage of 52% or lower is considered poor performance, while anything else is considered good performance. Create a new Performance metric that includes a conditional analysis based on the Avg On-time (%) metric. This conditional analysis can be done by creating a derived metric that uses the If conditional function.
IF(([Average (On-time %)]<=0.52), "Poor", "Good")
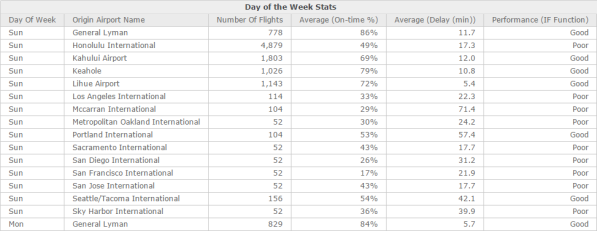
Continue your analysis by breaking down performance by Origin Airport Name. Drag the Origin Airport Name attribute from the Datasets panel to the Rows area of the Editor panel.
If you want to qualify the values of a metric into more than two groups, create a derived metric using the Case function. Modify the Performance metric to use an expression that qualifies performance into three groups rather than two. The Excellent group denotes airports that have an average on-time percentage greater than 60%.
Case(([Average (On-time %)]<=0.52), "Poor", ([Average (On-time %)]>0.6), "Excellent", "Good")
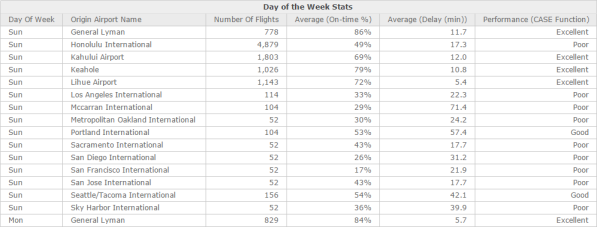
The Case function provides the same conditional analysis as the If function. However, the If function can only qualify metric values into two different groups, while the Case function can qualify metric values into two or more groups. The Case function allows you to specify two or more conditions to use to evaluate the metrics you are interested in.
You can apply qualifications on more than one metric in an If or Case function. You can assess the performance of flights based on both the average on-time percentage and the average delay in minutes. Having an average on-time percentage of 52% or lower combined with an average delay time of 15 minutes or greater is considered poor performance, while anything else is considered good performance. Create a new Performance metric that includes a conditional analysis based on the Average (On-time %) metric and the Average (Delay (min)) metric.
IF((([Average (On-time %)] <= 0.52) And ([Average (Delay (min))] >= 15)),"Poor","Good")
Since a conditional analysis is created as a derived metric, rather than included in a visualization as a filter, all the results of a conditional analysis appear on a visualization at once. In the examples above, this allows you to view data about all airports, both those that are performing well and those that are performing poorly. Applying a filter to a visualization, in contrast, hides the data on a visualization that does not meet the filter condition.
To Perform Conditional Calculations with Derived Metrics
 to the right of the dataset in which you are creating a derived metric and choose Create Metric.
IF(Condition, TrueResult, FalseResult) where:Condition is the conditional expression. The condition can contain metrics, comparison and logical operators, and constants. The condition must be evaluated to be TRUE or FALSE.TrueResult is a constant or metric value to return if the condition is TRUE. To display text as the value that is returned, enclose the text in double quotes ("").FalseResult is a constant or metric value to return if the condition is FALSE. To display text as the value that is returned, enclose the text in double quotes ("").Condition(Condition1, ReturnValue1, Condition2, ReturnValue2,..., DefaultValue) where:Condition1 is the first condition to evaluate. The condition can contain metrics, comparison and logical operators, and constants.ReturnValue1 is a constant or metric value to return if the Condition1 condition is TRUE. To display text as the value that is returned, enclose the text in double quotes ("").Condition2 is the second condition to evaluate. The condition can contain metrics, comparison and logical operators, and constants.ReturnValue2 is a constant or metric value to return if the Condition2 condition is TRUE. To display text as the value that is returned, enclose the text in double quotes ("").... (ellipsis) represents any number of condition and return value combinations that can be used to create another logical group. Every condition must have a return value.DefaultValue is a constant or metric value to return if none of the conditions are TRUE. To display text as the value that is returned, enclose the text in double quotes ("").Related Topics
Creating a derived metric from scratch using the metric formula editor
Creating a derived metric from an attribute
How to Create a Derived Metric by Selecting the Aggregation Function
Introduction to Advanced Filtering
Changing the aggregation and subtotal behavior for a derived metric
Editing derived metrics from the dossier
Renaming derived metrics from the dossier
Deleting derived metrics from the dossier
Creating a derived metric on a Grid using a shortcut
Creating a derived metric using the metric function editor
How to Create a Derived Metric by Combining Two Metrics with an Operator
How to Create a Derived Metric by Combining Multiple Metrics
 Copyright Numerify, Inc. All Rights Reserved ©2021